Spectrum Display RFI Tracking
Page content last updated Feb. 4, 2017
Copyright © 2017 Larry Benko, W0QE
A couple of years ago I got involved with helping Dale, W0DGD who had a big interference problem on the upper end of 80m. His neighborhood, in southwest Denver,CO, was built about 45 years ago and has overhead telephony wiring. The interference, as heard with a radio demodulating an SSB signal, appeared similar to wideband noise with little in the way of distinguishing characteristics. Early attempts to track this noise down via conventional loop antennas was not very successful. Some research by Tom, W0IVJ convinced him thay the interference might be one of the upstream data frequency bands for the VDSL2 service that Century Link uses to provide data and their Prism TV service based on the frequency of the interference.
I had been thinking about building a broadband tracking system for other purposes and this provided the impetus to get moving with this project.
Please look at the link on this web site at "Active Monopole Amplifier" for the hardware specifics.
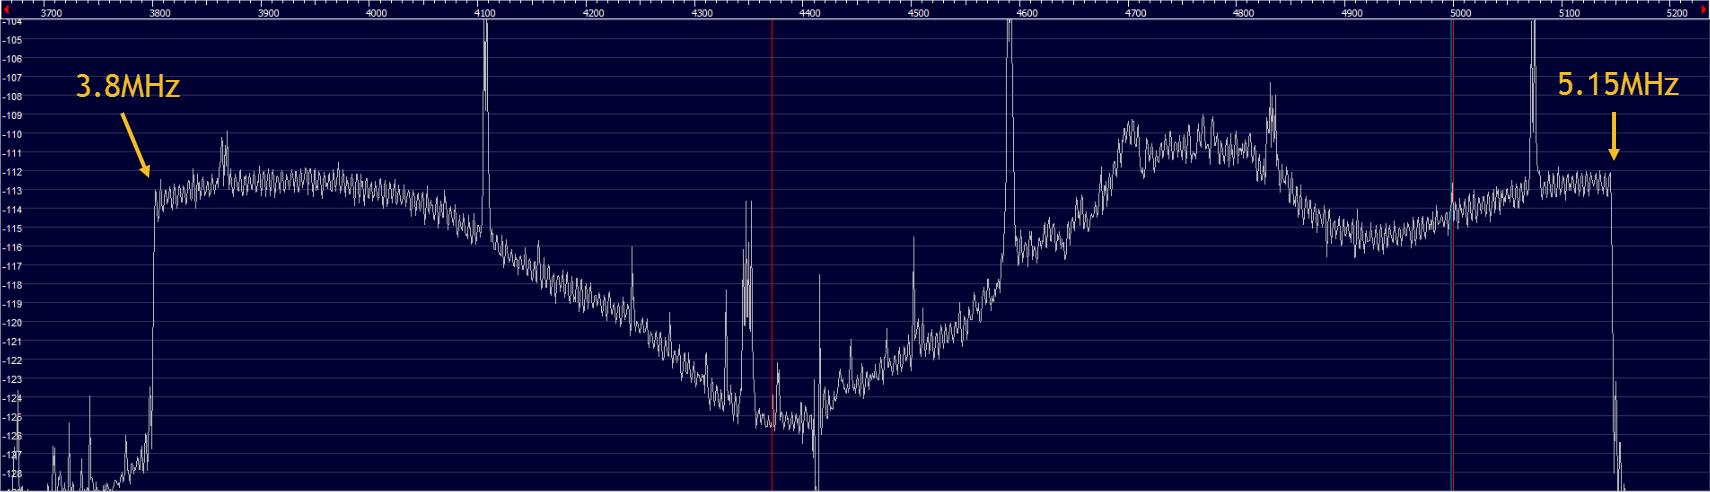
After building the initial system and driving around the neighborhood we discovered several sources of RFI that we were reasonably sure was VDSL2 upstream data. The graph below shows the upstream characteristics starting at 3.8MHz and stopping at 5.15MHz. The graph is a screen capture from the HDSDR program controlling an SDR Play radio which had an external filter to eliminate AM broadcast overload. The abrupt noise increase at 3.8MHz was about 15dB. Driving past other houses showed similar interference spectrums but the shape of the amplitude envelope in the 3.8MHz to 5.15MHz range varied significantly. This is believed to be associated with modem optimization for the individual telephone lines.
Century Link was contacted and we had a meeting at the site of the interfence with Century Link management, engineers, and craft people. They were adamant that VDSL2 was built with non-radiating technology and the interference was not due to their equipment. We convinced them to temporarily turn off the VDSL2 service to the home that we were sure was the source of the interference. Amazingly interference ceased. Without the ability to see the frequency spectrum before and after we would have had a difficult time convincing them that they were the source of the interference over such a wide frequency range. Century Link readily agreed that this was interference from VDSL2. The craftperson went to the interferring house and found several wiring issues and was able to reduce the interference significantly which also improved the signal to noise ratio (SNR) as seen by the modem. The on premise wiring is owned by the customer and may contain stubs and other wiring issues which contributes hugely to the problem of radiated interference. After the repair work we could still see the VDSL2 RFI on the spectrum display but it was only a few dB above the base noise level.
Later after the "management folks" had left we drove through the neighborhood with a Century Link engineer in the vehicle with us and played a little game of "VDSL2 or not". We were able to determine with 100% accuracy whether a home had Century Link VDSL2 service or not. In this neighborhood the spacing between homes was 10-20 feet and we would not have been able to pinpoint the VDSL2 users in a higher population density area. This would have been an impossibility without the spectrum display. The "signature" of the spectrum dispay was incredibly valuable in the positive identiification of the RFI source. I can not stress strongly enough that the ability to see the spectrum is incredibly valuable. For more information about the frequency spectrums used by the different VDSL variants in both the USA and Europe click here.
I had been thinking about building a broadband tracking system for other purposes and this provided the impetus to get moving with this project.
Please look at the link on this web site at "Active Monopole Amplifier" for the hardware specifics.
After building the initial system and driving around the neighborhood we discovered several sources of RFI that we were reasonably sure was VDSL2 upstream data. The graph below shows the upstream characteristics starting at 3.8MHz and stopping at 5.15MHz. The graph is a screen capture from the HDSDR program controlling an SDR Play radio which had an external filter to eliminate AM broadcast overload. The abrupt noise increase at 3.8MHz was about 15dB. Driving past other houses showed similar interference spectrums but the shape of the amplitude envelope in the 3.8MHz to 5.15MHz range varied significantly. This is believed to be associated with modem optimization for the individual telephone lines.
Century Link was contacted and we had a meeting at the site of the interfence with Century Link management, engineers, and craft people. They were adamant that VDSL2 was built with non-radiating technology and the interference was not due to their equipment. We convinced them to temporarily turn off the VDSL2 service to the home that we were sure was the source of the interference. Amazingly interference ceased. Without the ability to see the frequency spectrum before and after we would have had a difficult time convincing them that they were the source of the interference over such a wide frequency range. Century Link readily agreed that this was interference from VDSL2. The craftperson went to the interferring house and found several wiring issues and was able to reduce the interference significantly which also improved the signal to noise ratio (SNR) as seen by the modem. The on premise wiring is owned by the customer and may contain stubs and other wiring issues which contributes hugely to the problem of radiated interference. After the repair work we could still see the VDSL2 RFI on the spectrum display but it was only a few dB above the base noise level.
Later after the "management folks" had left we drove through the neighborhood with a Century Link engineer in the vehicle with us and played a little game of "VDSL2 or not". We were able to determine with 100% accuracy whether a home had Century Link VDSL2 service or not. In this neighborhood the spacing between homes was 10-20 feet and we would not have been able to pinpoint the VDSL2 users in a higher population density area. This would have been an impossibility without the spectrum display. The "signature" of the spectrum dispay was incredibly valuable in the positive identiification of the RFI source. I can not stress strongly enough that the ability to see the spectrum is incredibly valuable. For more information about the frequency spectrums used by the different VDSL variants in both the USA and Europe click here.
Driving around with a 0.1" (2.5mm) diameter 48" (1.2m) long whip on the roof of your car is quite stealthy and draws very little attention to you. If you are driving alone it is easy to record the spectrum and a real time moving map display without needing to look at the laptop. Then you can play the .mp4 video when you get home and analyze the RF spectrum vs the map location. I have used DeLorme Street Atlas for the moving map display and Open Broadcast Software (OBS) for the screen capture. Tom, W0IVJ has a YouTube video of OBS capturing the screen of his laptop while driving in his neighborhood. The laptop was running HDSDR in the upper part of the screen and Street Atlas in the lower part. An equivalent solution is to use an app which allows you to project Google Maps from your smartphone to your laptop.
The signal sensitivity of this setup is such that it can hear any signal that a dipole can hear from your home station. This is shown on the the web page describing the "Active Monopole Amplifier". I hope this will help in your quest to track RF interference.
The signal sensitivity of this setup is such that it can hear any signal that a dipole can hear from your home station. This is shown on the the web page describing the "Active Monopole Amplifier". I hope this will help in your quest to track RF interference.